CHALLENGE INFORMATION
 | Platform: TryHackMe Module: Malware Analysis Room: Windows Internals |
DESCRIPTION:
Learn and understand the fundamentals of how Windows operates at its core.
Learning Objectives
- Understand and interact with Windows processes and their underlying technologies.
- Learn about core file formats and how they are used.
- Interact with Windows internals and understand how the Windows kernel operates.
Introduction
The main focus is on empowering red teams (cybersecurity professionals who simulate attacks) to understand and exploit Windows internals for various purposes, such as evasion and exploitation when crafting offensive tools or exploits.
This knowledge is crucial in a corporate setting where Windows machines are prevalent.
RDP Access
- Machine IP: <targetbox-ip>
- Username: THM-Attacker
- Password: Tryhackme!
Question 1: Start the provided machine and move on to the next tasks.
No answer needed
Processes
A process in Windows refers to the execution of an application, which can contain one or more threads of execution. A process comprises various components:
- a private virtual address space;
- executable code and program data;
- open handles to system objects;
- a security context;
- a unique process identifier (process ID);
- environment variables;
- a priority class;
- minimum and maximum working set sizes; and
- at least one thread of execution.
Processes are created when an application runs and are essential for Windows functionality.
Attackers can target processes to evade detection and hide malware by using techniques such as Process Injection, Hollowing, or Masquerading.
A process also has lower-level components that reside in the virtual address space: code, global variables, heap memory (process heap), resources (open files), the environment block, and its threads.
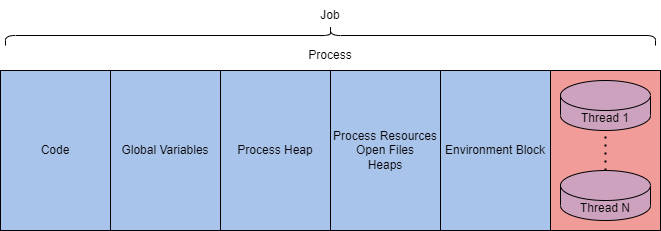
Figure 1: Process memory layout showing virtual address space components
These components can be observed in detail using utilities such as Process Hacker 2, Process Explorer, or Procmon, which display essential process details such as name, PID, status, and user name.
Overall, processes are a fundamental concept in Windows that play a crucial role in the operating system’s functionality and security.
Questions & Answers
First, we launch Procmon by opening the ProcessMonitor folder on our Desktop
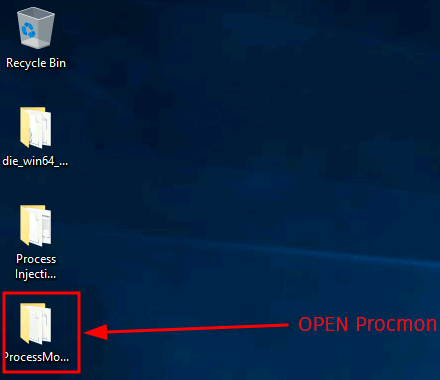
Figure 2: ProcessMonitor folder containing the Procmon executable
and then run the Procmon executable.
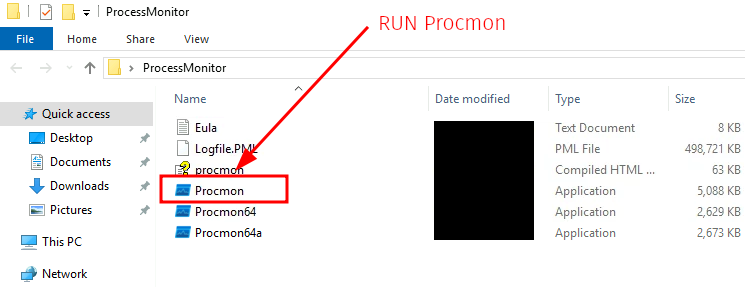
Figure 3: Process Monitor application launching
Make sure to agree to the terms to accept the provided EULA.
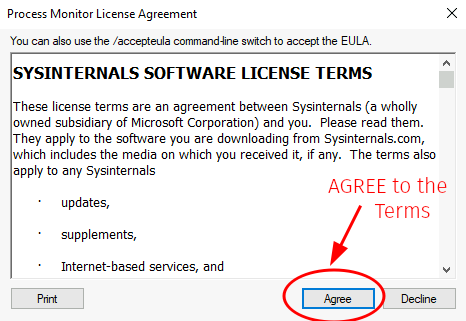
Figure 4: Accepting the license agreement terms
Furthermore, ensure that you provide all necessary permissions for the program to run.
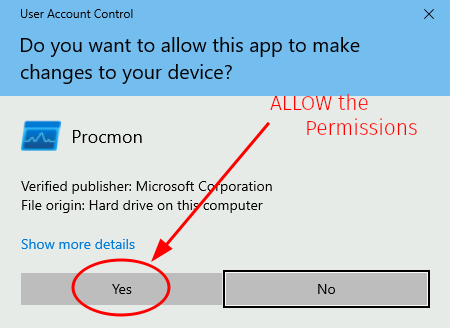
Figure 5: Accepting the User Account Control prompt
Continue by opening the log file. Click File > Open…,
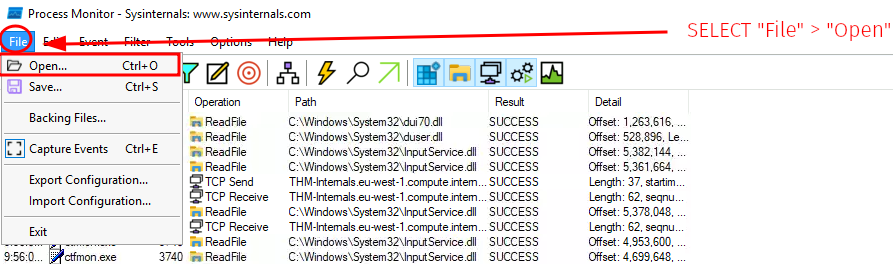
Figure 6: Opening the File menu to access the log file
and then select the Logfile file located in the ProcessMonitor folder on our Desktop.
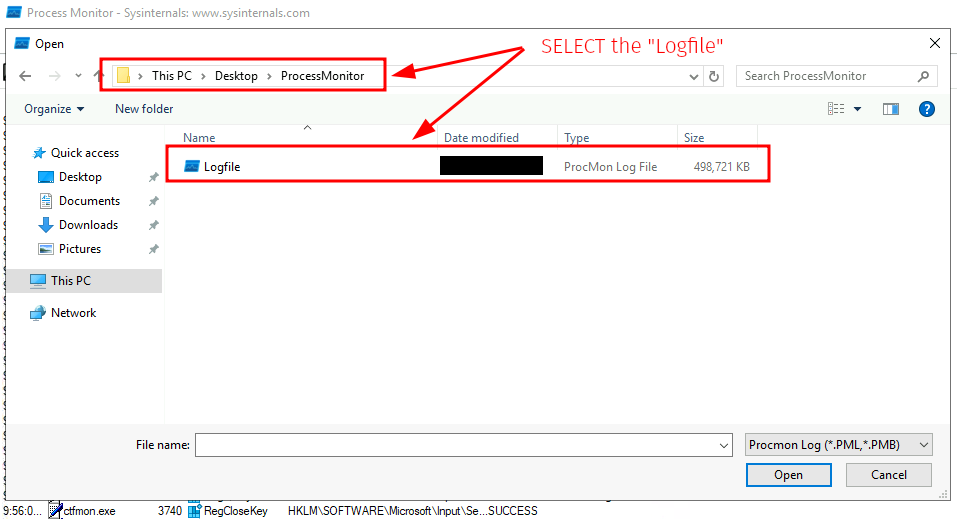
Figure 7: Selecting the Logfile.PML capture file
Question 1: Open the provided file: Logfile.PML in Procmon and answer the questions below.
No answer needed
Filter by Process Name for notepad.exe to answer the following questions.
First, we select Filter > Filter,
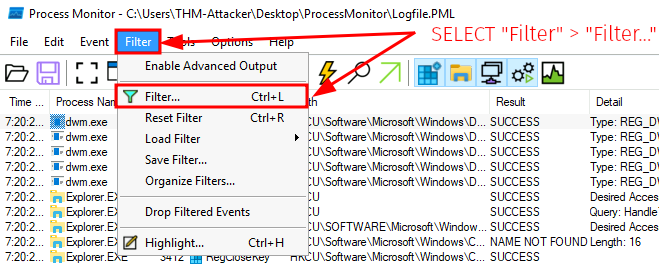
Figure 8: Accessing the Filter menu
then select Process Name as the filter criterion and specify ’notepad.exe’ as our target.
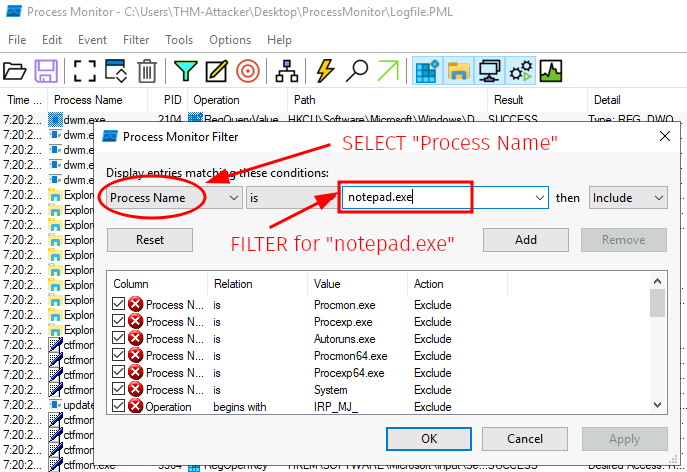
Figure 9: Configuring the filter for notepad.exe
Lastly, we ensure our filter is active by adding the item.
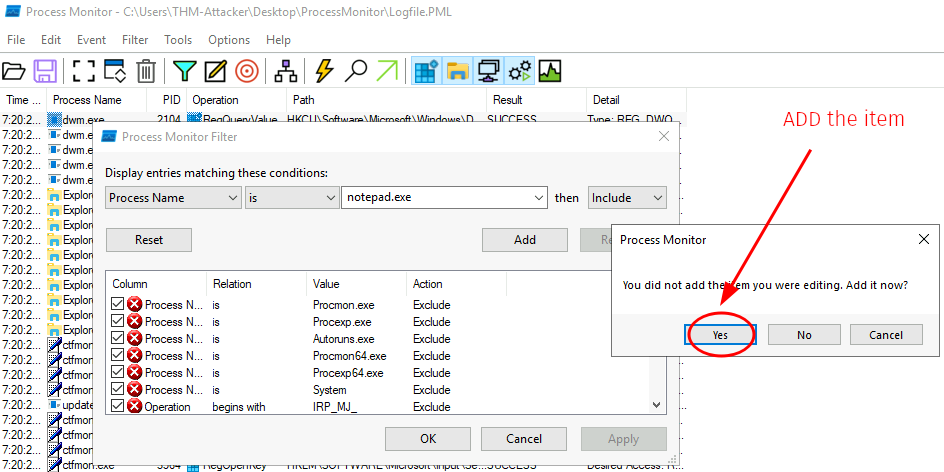
Figure 10: Adding the notepad.exe filter rule
To answer the questions below, we check the first event’s properties by selecting the entry and clicking the lightning bolt symbol, or by right-clicking and selecting its properties.

Figure 11: Accessing event properties
We find all the answers by selecting the Process view.
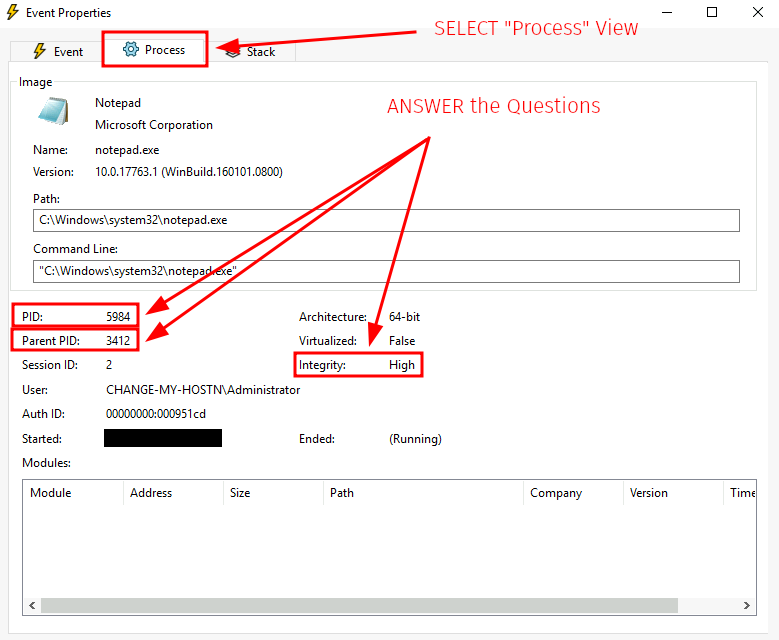
Figure 12: Process tab displaying process ID, parent PID, and integrity level
Question 2: What is the process ID of notepad.exe?
5984
Question 3: What is the parent process ID of the previous process?
3412
Question 4: What is the integrity level of the process?
High
Threads
A thread is an executable unit within a process that is scheduled based on device factors such as CPU and memory specifications, priority, and logical factors. Threads are essentially controllers of process execution.
Characteristics shared with the parent process include code, global variables, and resources. Unique values and data specific to each thread include:
- Stack: stores data relevant to the thread (exceptions, procedure calls, and so on);
- Thread Local Storage: allocates storage for a unique data environment;
- Stack Argument: a unique value assigned to each thread; and
- Context Structure: holds machine register values maintained by the kernel.
Threads are a critical component of processes and can be targeted by attackers for malicious purposes, such as code execution or chaining with other API calls.
Questions & Answers
Since we have Logfile.PML already open in Procmon, we continue where we left off in our previous task.
Question 1: Open the provided file: Logfile.PML in Procmon and answer the questions below.
No answer needed
For the next two questions, we first search for the first event where the Operation field matches ‘Thread Create’ to identify threads created by notepad.exe.
Since the events are ordered chronologically, the first matching event is the one we seek.

Figure 13: Locating the Thread Create operation for notepad.exe
Question 2: What is the thread ID of the first thread created by notepad.exe?
5908
By opening its properties, we can find the answers to both questions.
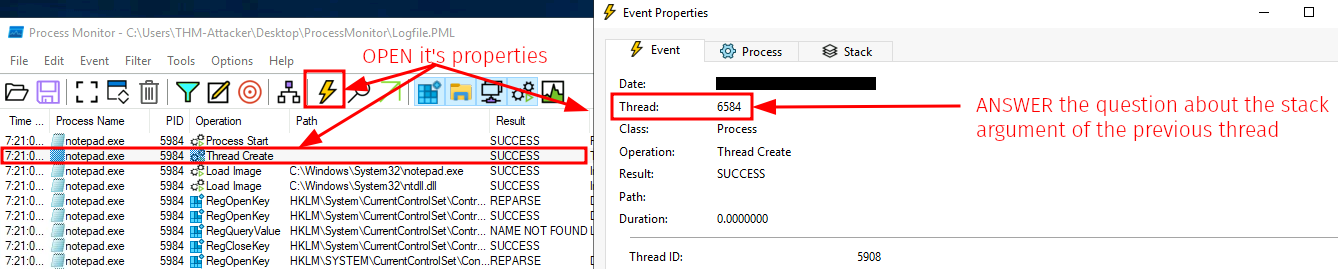
Figure 14: Thread properties displaying thread ID and stack argument
Question 3: What is the stack argument of the previous thread?
6584
Virtual Memory
Virtual memory allows different processes to use memory as if it were physical memory without the risk of collisions or conflicts between applications.
Each process has its own private virtual address space, managed by the memory manager. The memory manager translates virtual addresses to physical addresses and can transfer or page virtual memory to disk when an application uses more virtual memory than physical memory allocated.
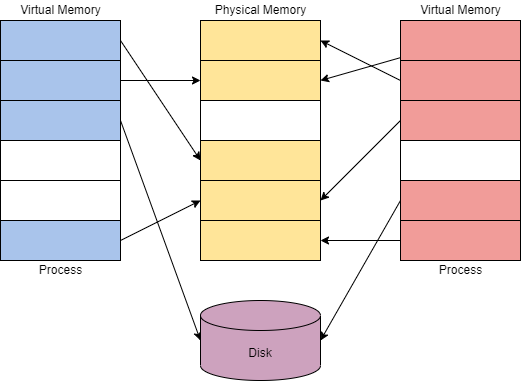
Figure 15: Virtual memory architecture showing address translation
On a 32-bit x86 system, the maximum virtual address space is 4 GB, with the lower half (0x00000000–0x7FFFFFFF) allocated to processes and the upper half (0x80000000–0xFFFFFFFF) allocated to OS memory utilization.
On a 64-bit modern system, the maximum virtual address space is 256 TB, with a similar allocation layout.
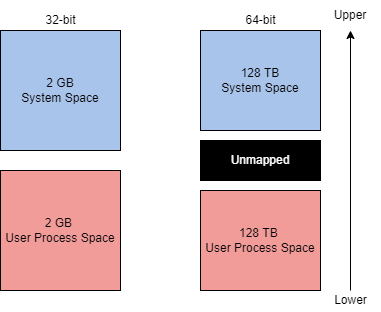
Figure 16: Virtual memory allocation layout for 32-bit and 64-bit systems
Questions & Answers
Question 1: Read the above and answer the questions below.
No answer needed
Question 2: What is the total theoretical maximum virtual address space of a 32-bit x86 system?
4 GB
Question 3: What default setting flag can be used to reallocate user process address space?
increaseuserva
Question 4: Open the provided file: Logfile.PML in Procmon and answer the questions below.
No answer needed
Question 5: What is the base address of notepad.exe?
0x7ff652ec0000
Since we are looking for the base address of notepad.exe, we search for the event where the binary was loaded.
Note the Operation field, which shows ‘Load Image’, and the full path for our executable. We can find the Image Base either under the event’s Detail field or by opening its properties.

Figure 17: Locating the Load Image operation to identify the base address
Dynamic Link Libraries
Dynamic Link Libraries (DLLs) are libraries that contain code and data used by multiple programs simultaneously. They promote modularization, code reuse, efficient memory usage, and reduced disk space, enabling Windows applications to load faster, run faster, and consume less disk space.
DLLs can be targeted by attackers to control aspects of execution or functionality:
- DLL Hijacking (T1574.001)
- DLL Side-Loading (T1574.002)
- DLL Injection (T1055.001)
DLLs are created like any other project or application, requiring slight syntax modification. They can be loaded into an application using either load-time dynamic linking or run-time dynamic linking:
- Load-time dynamic linking involves explicit calls to DLL functions from the application, requiring a header file and import library.
- Run-time dynamic linking involves loading the DLL at run time using
LoadLibraryorLoadLibraryEx, then usingGetProcAddressto identify and call the exported DLL function.
Malicious code often uses run-time dynamic linking because it allows for easier transfer of files between memory regions.
Questions & Answers
Question 1: Open the provided file: Logfile.PML in Procmon and answer the questions below.
No answer needed
Given the previous tasks, we have already completed this step. For the next two questions, we could filter by Operation, specify ‘Load Image’ as our target, and then search for ’ntdll.dll’. Alternatively, we can simply locate it as the fourth event associated with notepad.exe.
Once we have located the correct event – where the Operation field shows ‘Load Image’ and the Path field contains ’ntdll.dll’ – examine the event’s Detail field.

Figure 18: Examining the Load Image operation for ntdll.dll
Question 2: What is the base address of ntdll.dll loaded from notepad.exe?
0x7ffd0be20000
Question 3: What is the size of ntdll.dll loaded from notepad.exe?
0x1ec000
Question 4: How many DLLs were loaded by notepad.exe?
51
Two filters are necessary to obtain the correct answer. First, we filter to include only events where something was loaded by selecting Operation with ‘Load Image’.
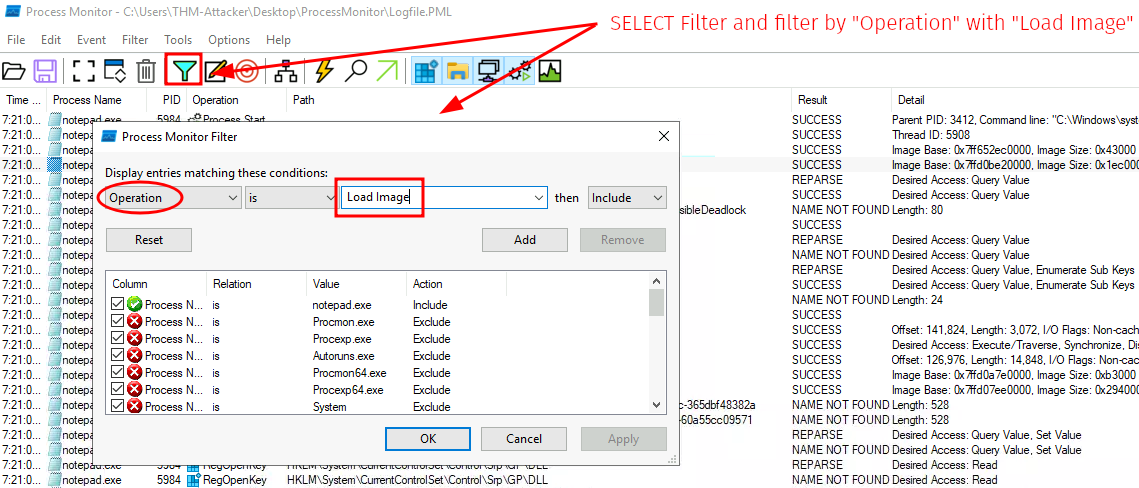
Figure 19: Filtering for Load Image operations
Since we are interested only in loads where a DLL was loaded, we add a second filter specifying that the Path must contain ‘.dll’.
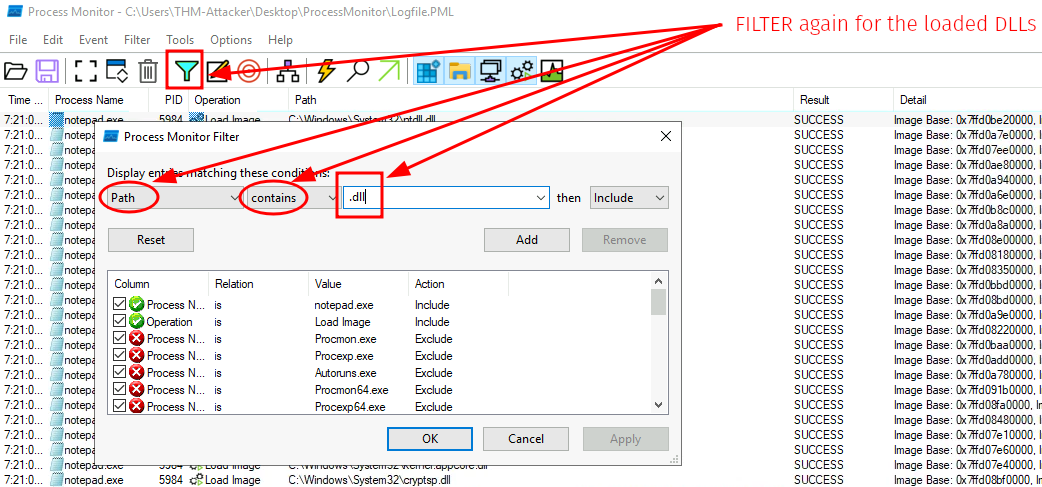
Figure 20: Adding the path filter for DLL files
Once complete, the correct answer appears in the bottom-left corner of the window.
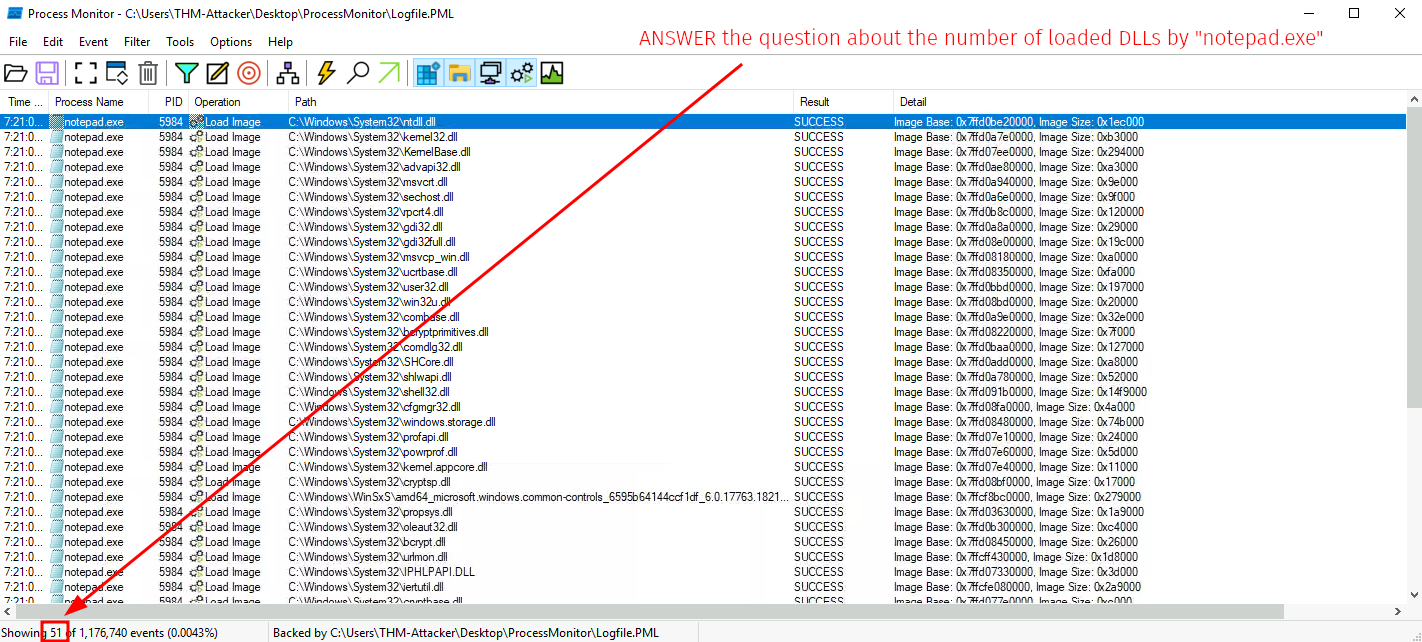
Figure 21: Total count of DLLs loaded by notepad.exe
Portable Executable Format
The PE (Portable Executable) format defines the information about the executable and stored data, as well as the structure of how data components are stored.
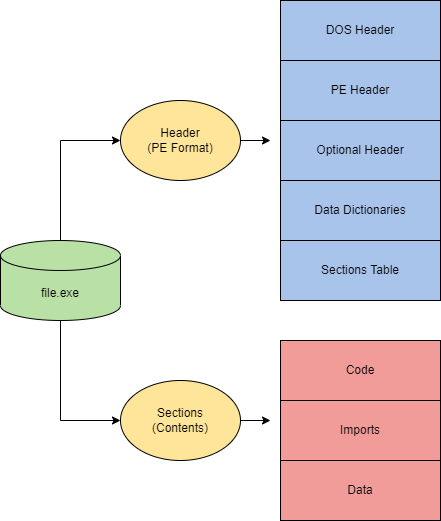
Figure 22: PE file format structure overview
PE Data Components:
- DOS Header: defines the type of file (
MZindicating.exe) - DOS Stub: a program run by default at the beginning of a file that prints a compatibility message (“This program cannot be run in DOS mode”)
- PE File Header: defines the format of the file; contains the signature, image file header, and other information headers
- Image Optional Header: part of the PE File Header
- Data Directories: point to the image data directory structure
- Section Table: defines the available sections and information in the image
Sections:
- .text (executable code and entry point): contains the machine code executed by the CPU
- .data (initialized data): stores initialized variables and strings used by the program
- .rdata or .idata (imports and DLLs): lists the Windows API functions and DLLs imported by the executable
- .reloc (relocation information): provides information about addresses requiring adjustment when relocating the executable in memory
- .rsrc (application resources): contains application-specific data such as images, icons, and other resources
- .debug (debug information): stores debugging information used by debuggers
Note: The following image (Portable Executable File Format) is part of a comprehensive guide titled A Comprehensive Guide To PE Structure, The Layman’s Way and belongs to its respective authors.
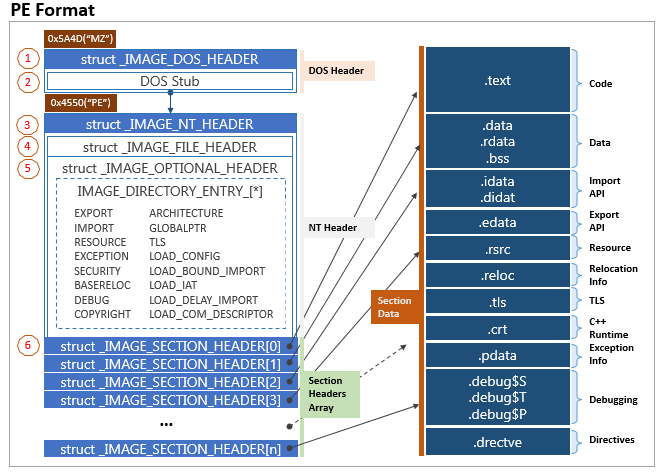
Figure 23: PE format structure from external reference
Questions & Answers
Question 1: Read the above and answer the questions below.
No answer needed
Question 2: What PE component prints the message ‘This program cannot be run in DOS mode’?
DOS Stub
Question 3: Open notepad.exe in Detect It Easy and answer the questions below.
No answer needed
We begin by opening the die_win64_portable_3.03 folder on our Desktop and running the Detect It Easy (DIE) application.
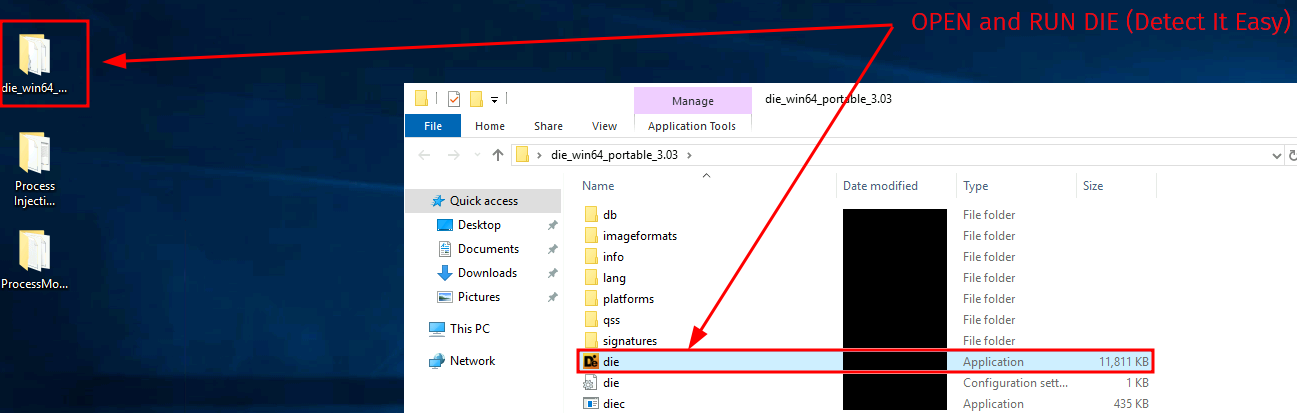
Figure 24: Opening the Detect It Easy portable folder
We proceed by opening notepad.exe. First, click the ellipsis button to open a file, then select our executable at C:\Windows\System32\notepad.exe.
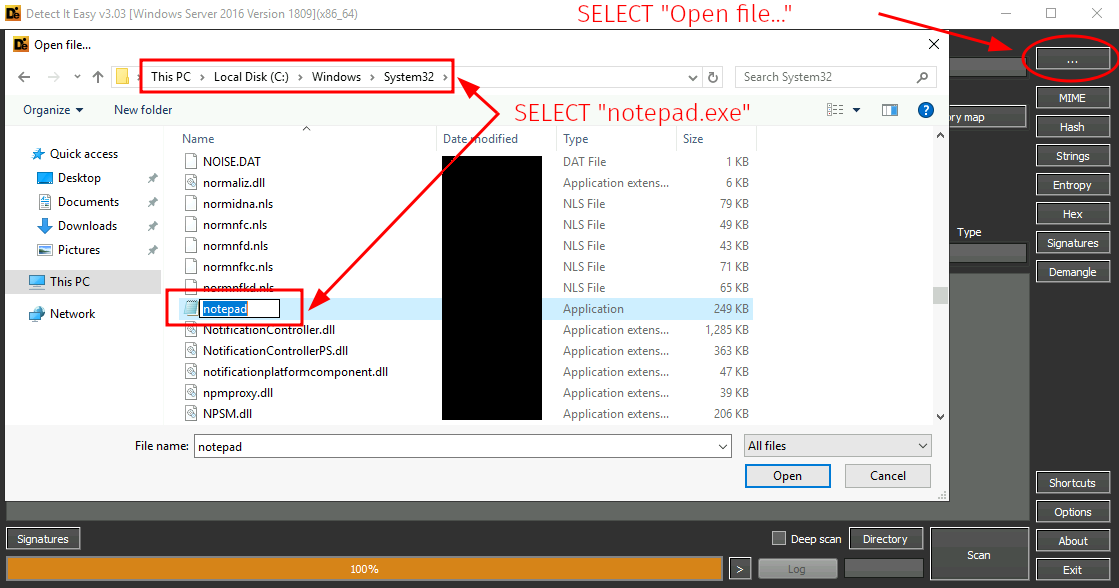
Figure 25: Selecting the notepad.exe executable in DIE
If everything was done correctly, we find the answer for the next question immediately after DIE finishes loading notepad.exe.
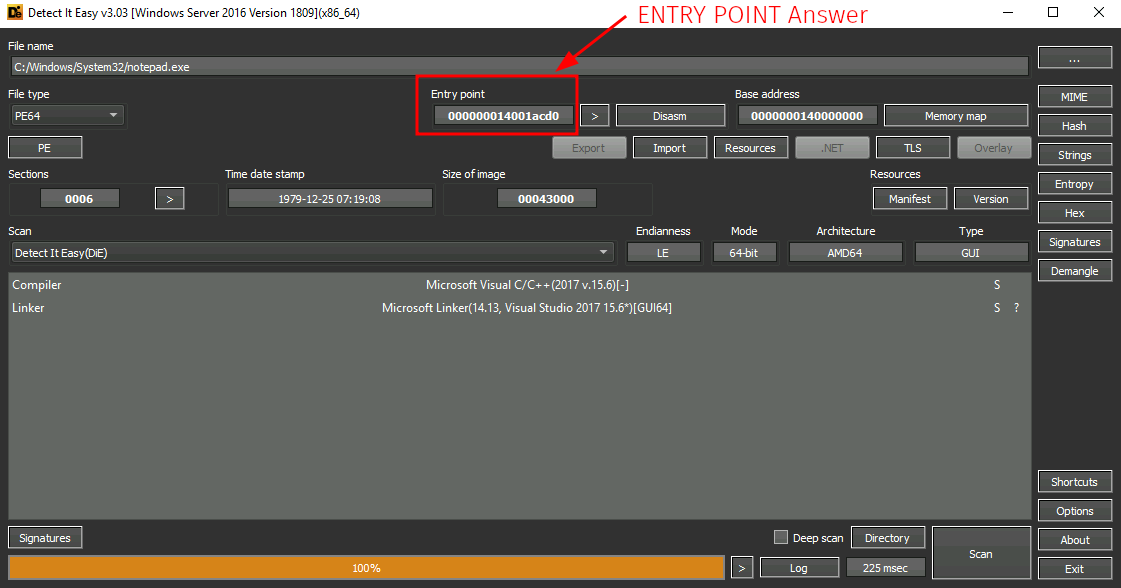
Figure 26: Entry point address displayed in DIE
Question 4: What is the entry point reported by DiE?
000000014001acd0
Click PE and select IMAGE_NT_HEADERS > IMAGE_FILE_HEADER to find the number of sections.
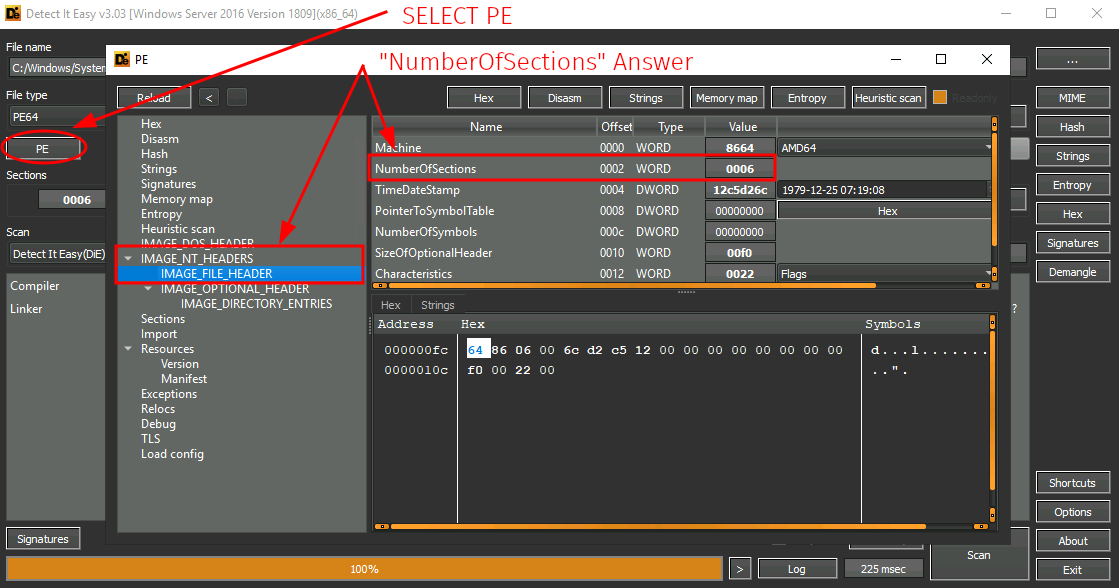
Figure 27: Locating the NumberOfSections value in the PE header
Question 5: What is the value of NumberOfSections?
0006
Still within PE, select Sections to view the .data section and its properties.
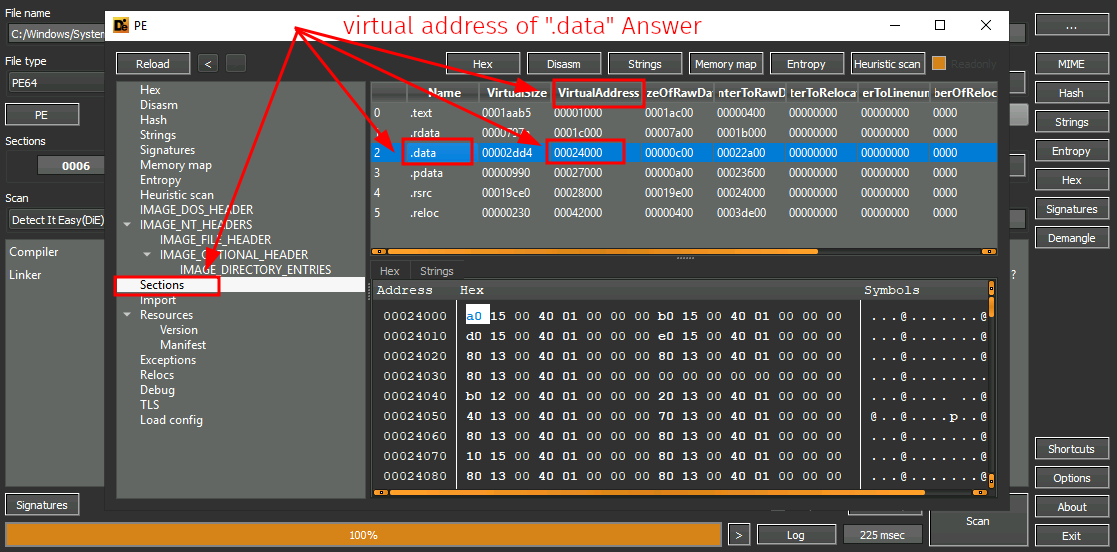
Figure 28: Virtual address of the .data section
Question 6: What is the virtual address of .data?
00024000
Finally, still in PE, select Strings and locate the matching offset value.
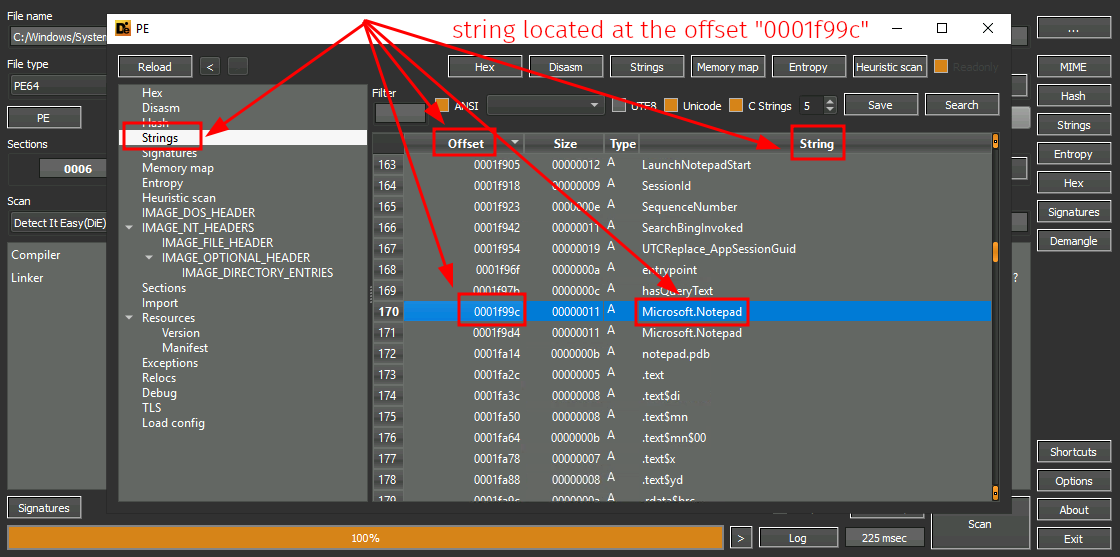
Figure 29: String table with offset 0001f99c highlighted
Question 7: What string is located at the offset 0001f99c?
Microsoft.Notepad
Interacting with Windows Internals
Interacting with Windows internals can be simplified using Windows API calls. The Windows API provides native functionality to interact with the operating system.
User Mode and Kernel Mode
Most Windows internals components require interacting with physical hardware and memory. An application by default cannot interact with the kernel or modify physical hardware and requires an interface. This problem is solved through the use of processor modes and access levels. The processor switches between these modes depending on access and requested mode.
Windows processors operate in two modes: user mode and kernel mode. System calls or API calls facilitate switching between these modes (the “switching point”).
User Mode
User mode, also known as userland, has the following characteristics:
- No direct hardware access
- Creates a process in a private virtual address space
- Access only to owned memory locations
Kernel Mode
Kernel mode has the following characteristics:
- Direct hardware access
- Runs in a single shared virtual address space
- Access to the entire physical memory
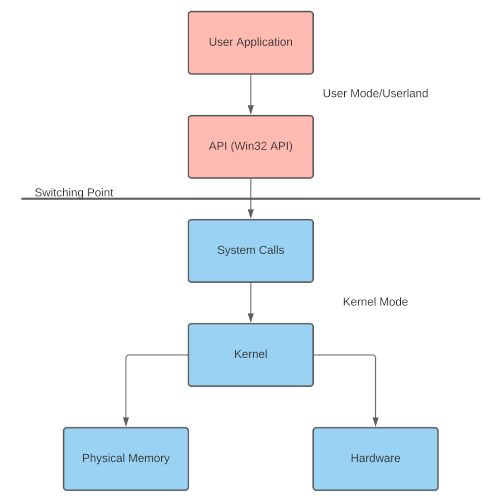
Figure 30: CPU mode switching between user and kernel mode
Writing to Memory: Injecting Arbitrary Code into a Local Process
- Step-1: Allocate local process memory for our code using
OpenProcessfor the process handle andVirtualAllocExto allocate memory. - Step-2: Write or copy our code to allocated memory using
WriteProcessMemoryto write the payload. - Step-3: Execute our code from local process memory using
CreateRemoteThreadto execute the payload from memory.
Questions & Answers
Question 1: Open a command prompt and execute the provided file: inject-poc.exe and answer the questions below.
No answer needed
To open a command prompt in the proper working directory, we first open the Process Injection POC directory on our Desktop. Then, we click the current path and overwrite it with ‘cmd’, which opens the command prompt in our desired destination.
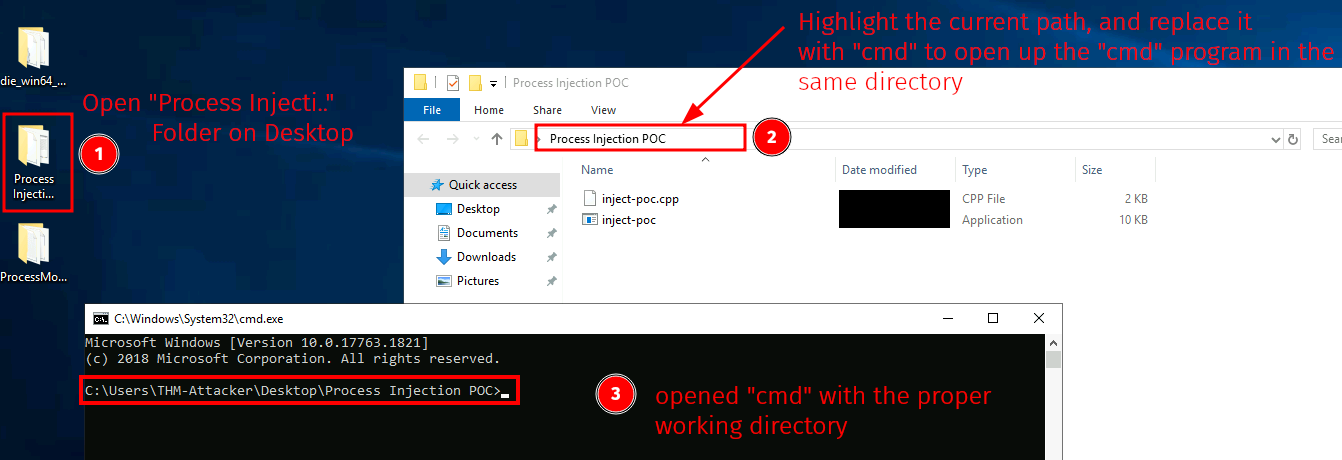
Figure 31: Opening command prompt in the Process Injection POC directory
Now we select the PoC executable and run it. Pressing Tab twice in Command Prompt autocompletes the filename, and we run it by pressing Enter.
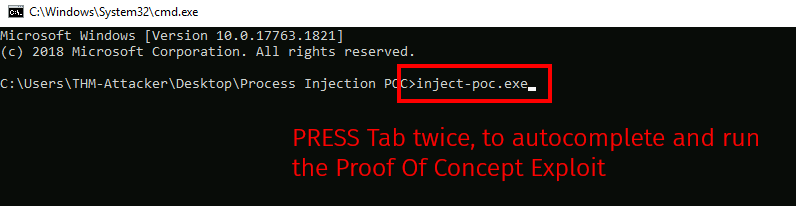
Figure 32: Running the inject-poc.exe proof-of-concept
Finally, we obtain the flag. Optionally, one could use the tools introduced in this room to analyze this exploit further and gather additional details.
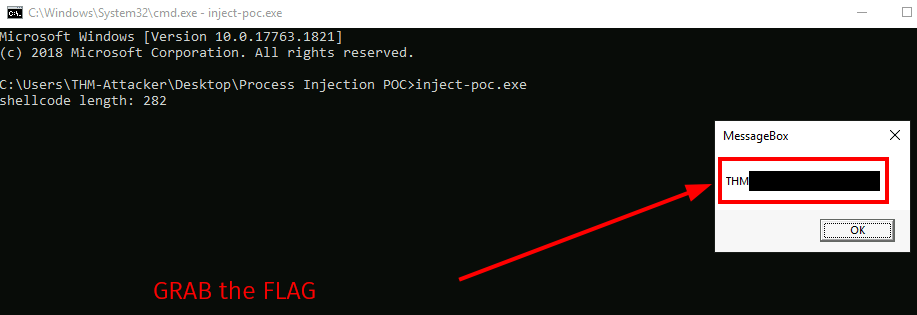
Figure 33: Flag displayed in message box
Question 2: Enter the flag obtained from the executable below.
<redacted-flag>
Conclusion
Question 1: Read the above and continue learning!
No answer needed