THM | AoC 2025 | Day 15
![]()
Day-15: Web Attack Forensics - Drone Alone
SUMMARY
Day 15 is about analyzing a web server compromise in Splunk by examining multiple log sources to trace an attack from initial access to post-exploitation activity. We first search web access logs and find Base64-encoded PowerShell payloads targeting a vulnerable CGI script ("hello.bat") from attacker IP 10.9.0.217. Decoding reveals a gloating message ("This is now Mine!"), confirming successful exploitation.
We then check Apache error logs to determine if attacks reached the backend or were blocked at the web layer. Next, we examine Sysmon process logs and discover child processes ("cmd.exe", "powershell.exe") spawned by Apache ("httpd.exe"), proving successful command injection at the OS level.
Lastly, we identify post-exploitation reconnaissance with "whoami.exe" commands, showing the attacker probing their privilege level. Finally, we search for encoded PowerShell commands in Sysmon logs and find none, indicating defenses successfully blocked further encoded payload execution.

Web Attack Forensics - Drone Alone
- TL;DR: Explore web attack forensics using Splunk.
- Original Room: TryHackMe | Advent of Cyber 2025 | DAY 15 - Web Attack Forensics - Drone Alone
STORYLINE
"TBFC's drone scheduler web UI is compromised by Base64-encoded malicious payloads in HTTP requests that trigger remote code execution on vulnerable endpoints. Splunk detected Apache spawning suspicious processes, revealing obfuscated shell code hidden within the payloads."
Preparation
Open up the Splunk Enterprise web interface/dashboard by visiting the provided link after starting the target VM. Be aware, that I might take a while for the setup to be ready, (~5+ min).
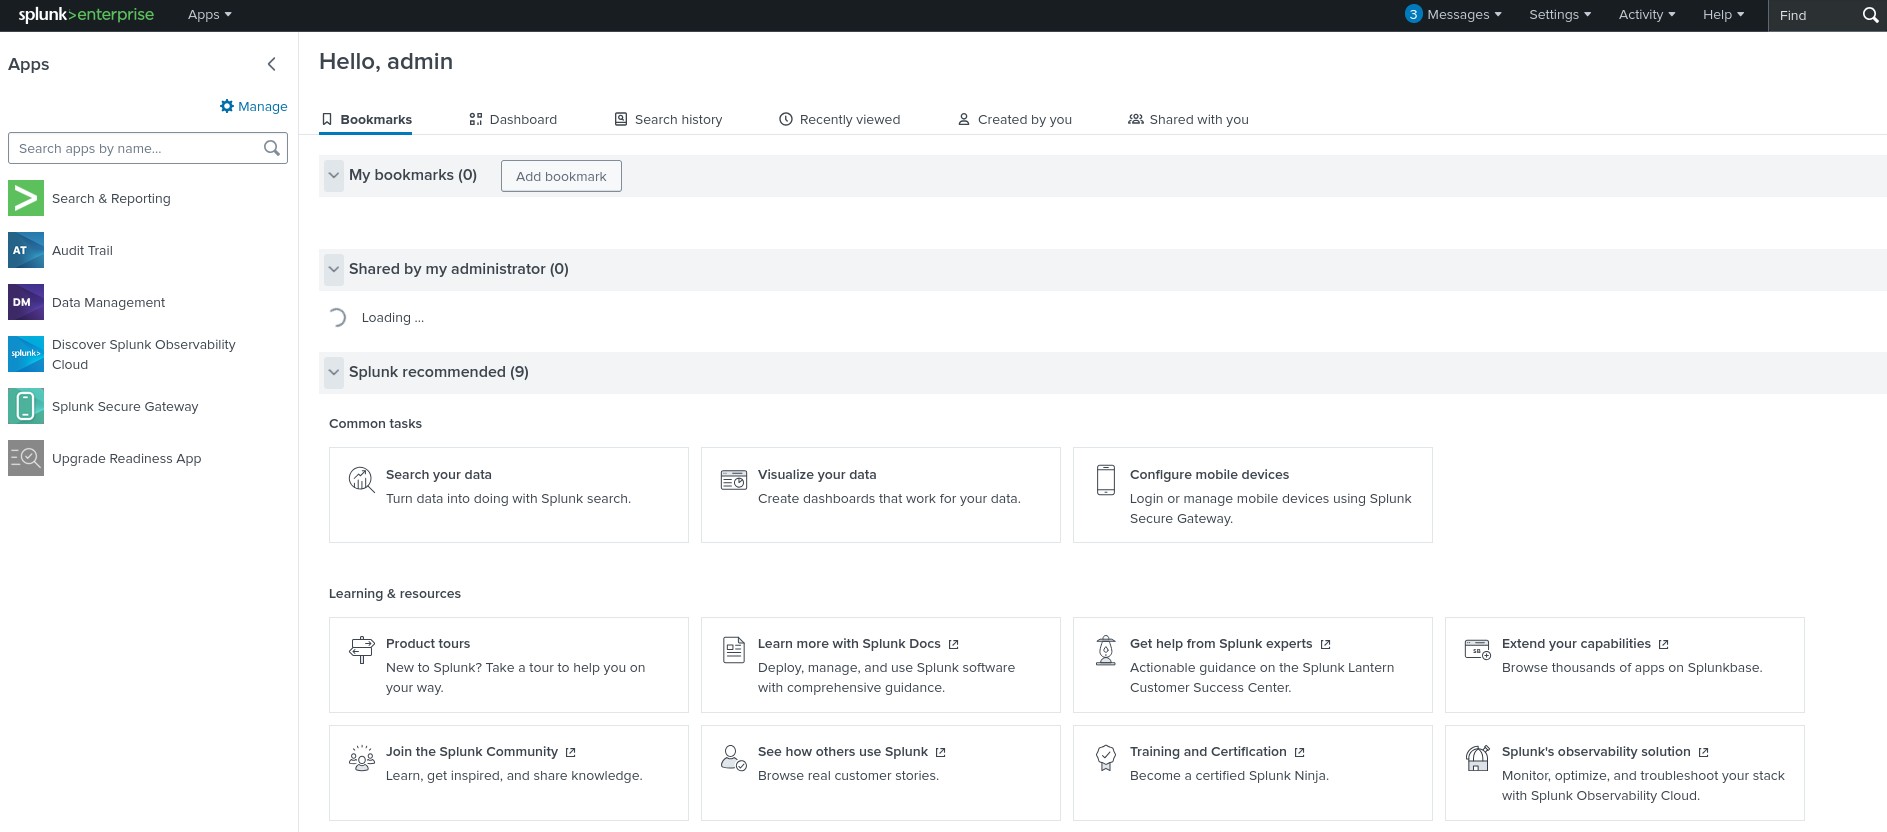
Figure 1: Splunk Enterprise Dashboard
Once the web interface is loaded, let's head over to "Search & Reporting".
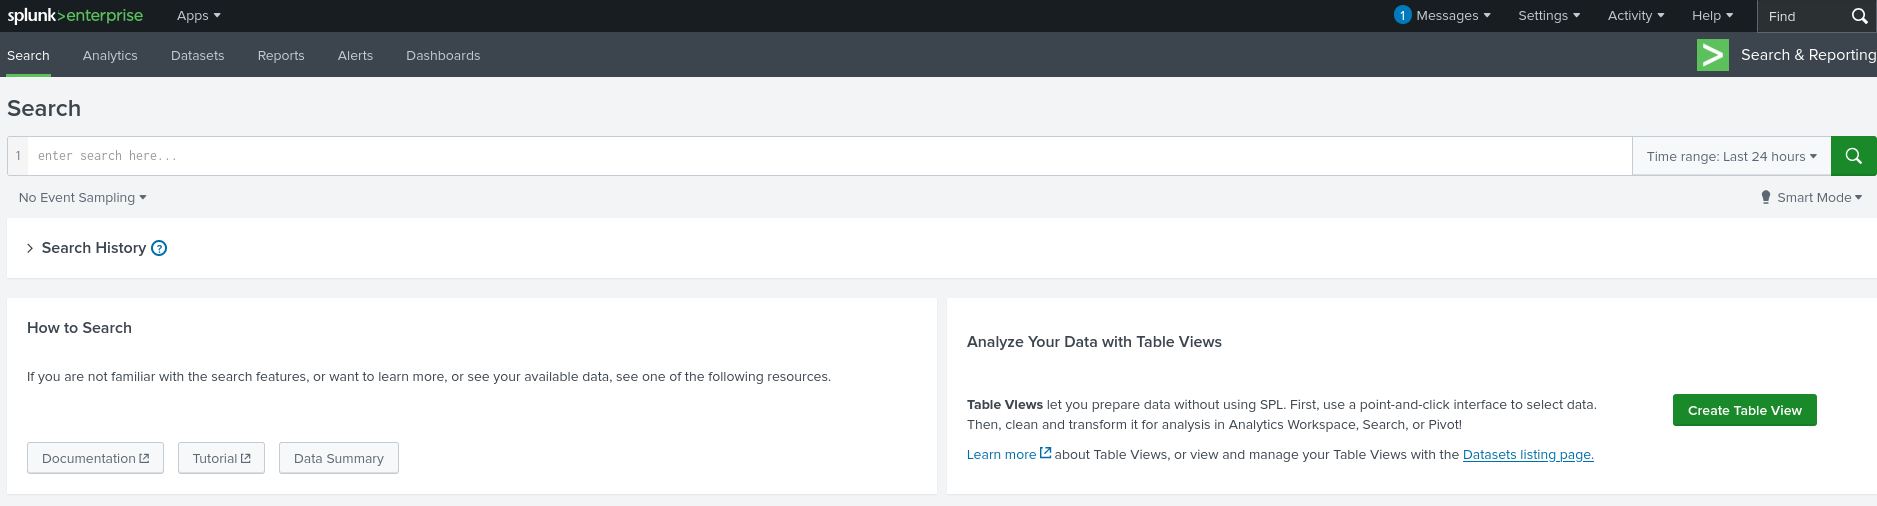
Figure 2: Splunk Enterprise Search & Reporting
Adjust the "Time range" for Searches to inlcude all the events that were reported by selecting "All time".
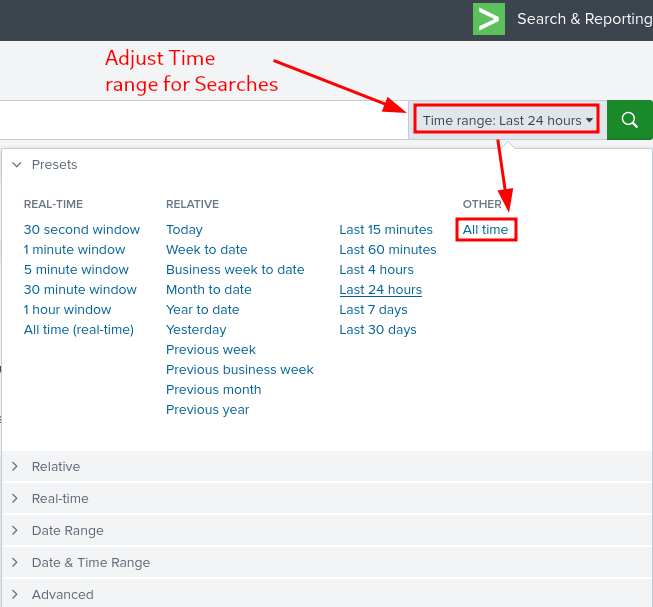
Figure 3: Splunk Enterprise - Adjusting Time range for Seaches
Web Logs
Web Access Logs
Search Web Access Logs for any HTTP requests including signs of command execution attempts like cmd.exe, PowerShell, Invoke-Expression and possible Command Injection attacks, where system command execution is done through a vulnerable CGI script (hello.bat)
index=windows_apache_access (cmd.exe OR powershell OR "powershell.exe" OR "Invoke-Expression") | table _time host clientip uri_path uri_query status
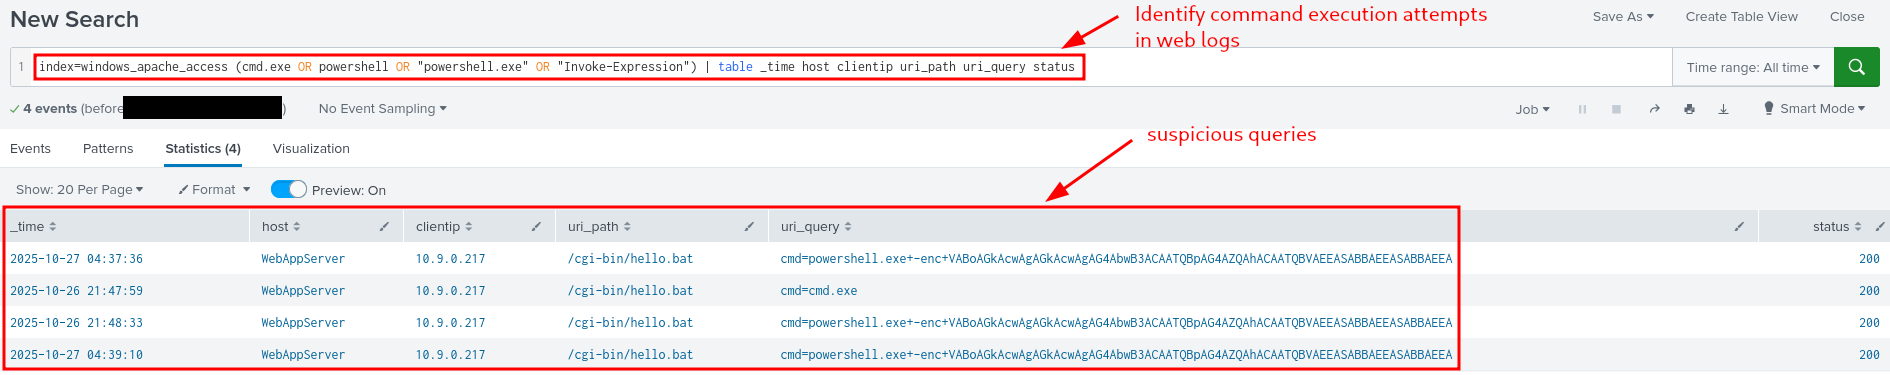
Figure 4: Looking for command execution attempts
Taking a closer look at the reported events we notice in the "uri_query" field some suspicious Base64 encoded PowerShell payloads. It's the same payload that's been tried 3 times: VABoAGkAcwAgAGkAcwAgAG4AbwB3ACAATQBpAG4AZQAhACAATQBVAEEASABBAEEASABBAEEA.
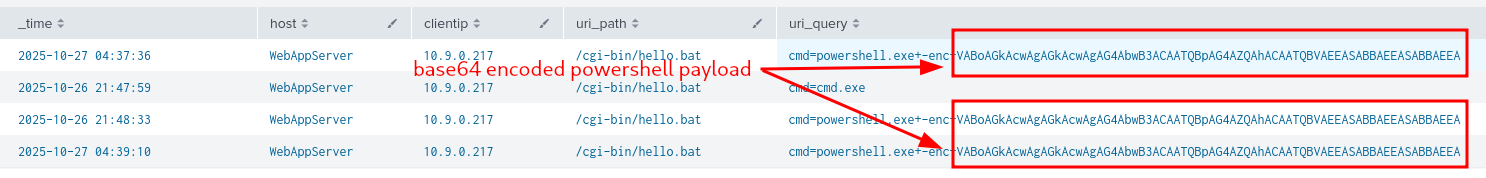
Figure 5: Base64 Encoded PowerShell payload
Let's try to decode it by heading over to our attacker Kali Machine, and using the -d (decode) option with base64:
┌──(user㉿KALI-THM)-[~]
└─$ echo -n "VABoAGkAcwAgAGkAcwAgAG4AbwB3ACAATQBpAG4AZQAhACAATQBVAEEASABBAEEASABBAEEA" | base64 -d
This is now Mine! MUAHAAHAA
┌──(user㉿KALI-THM)-[~]
└─$
Oh, the results are discouraging, we find a gloating message - "This is now Mine! MUAHAAHAA" - indicating a possibility that somebody already had some level of success penetrating our systems.
There is some other interesting data we can glean accompanying the encoded payload:
- Time Range: 2025-10-26 21:47:59 - 2025-10-27 04:39:10
- Host: "WebAppServer"
- Client IP: 10.9.0.217
- URI Path:
/cgi-bin/hello.bat - Response Status Codes: all 200
Web Error Logs
Looking for Server-Side Errors or Command Execution in Apache Error Logs
- looking for signs of execution attempts or internal failures by malicious requests
index=windows_apache_error ("cmd.exe" OR "powershell" OR "Internal Server Error")
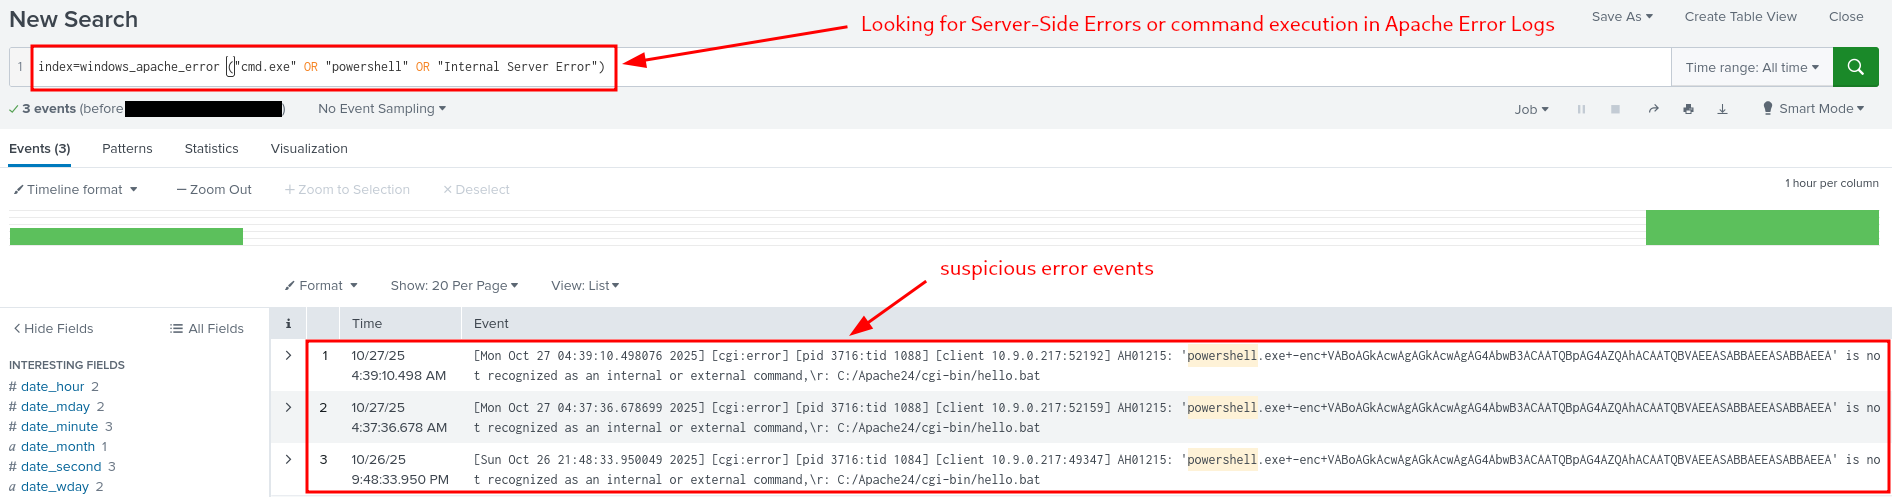
Figure 6: Failed Command Execution Attempts
Select "Raw" View instead of the default "List" View, by clicking on "View: List" and selecting "Raw" from the dropdown list.
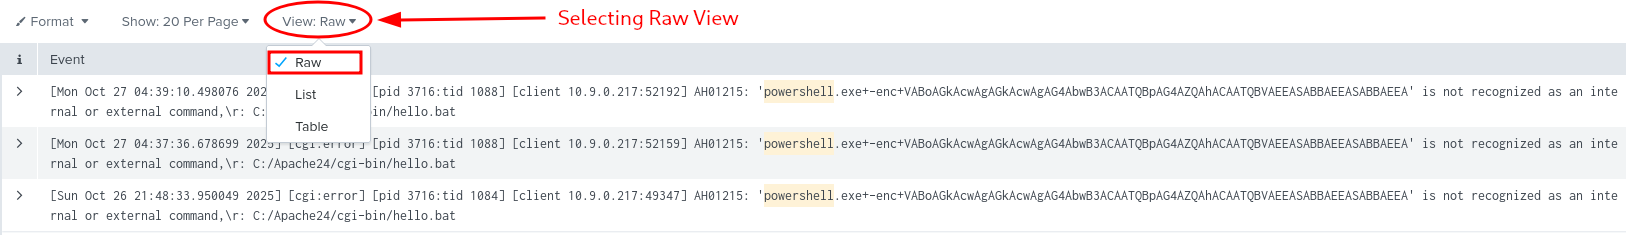
Figure 7: Selecting Raw View for better Readability
The Idea behind checking the errors is that some exploit attempts fail, get blocked - for example a request /cgi-bin/hello.bat?cmd=powershell triggering a 500 "Internal Server Error" could indicate that the attacker's input was processed by the server but failed during execution - which would indicate a clear exploitation attempt.
Simply put, checking the error logs help us confirm whether an attack reached the backend or remained blocked at the web layer.
Sysmon Data
Command Injection Attempts
Check Sysmon logs for processes spawn by "httpd.exe" (web-server):
index=windows_sysmon ParentImage="*httpd.exe"
There are 14 entries here, let's change our view from "List" to "Table" to get a better picture of the happenings.
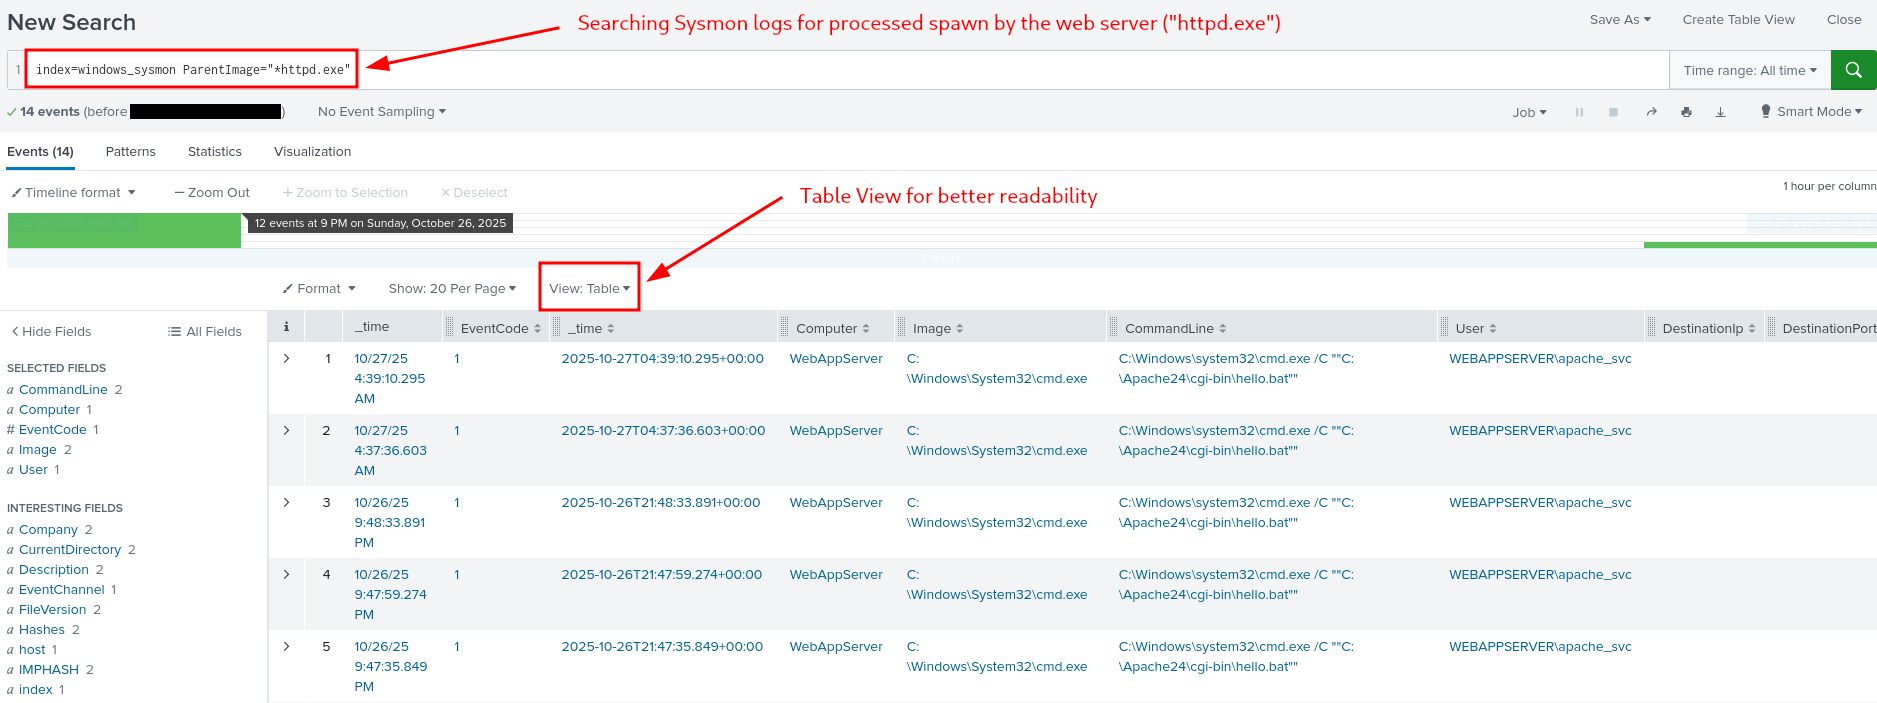
Figure 8: Processes spawn by the web server
To get some idea of what's happening here, keep in mind, that the Apache process should only spawn worker threads, not system processes like cmd.exe or powershell.exe. Therefore any results showing a child processes like Image = C:\Windows\System32\cmd.exe with Apache as the parent process (ParentImage = C:\Apache24\bin\httpd.exe) indicates successful command injection, where a system command was executed by Apache.
To sum it up, this finding indicates that the web attack penetrated the operating system.
Enumerating suspicious Activity
Searching for Indicators for post-exploitation reconnaissance: like the attacker running whoami in cmd to determine which user account their malicious process is running as
index=windows_sysmon *cmd.exe* *whoami*
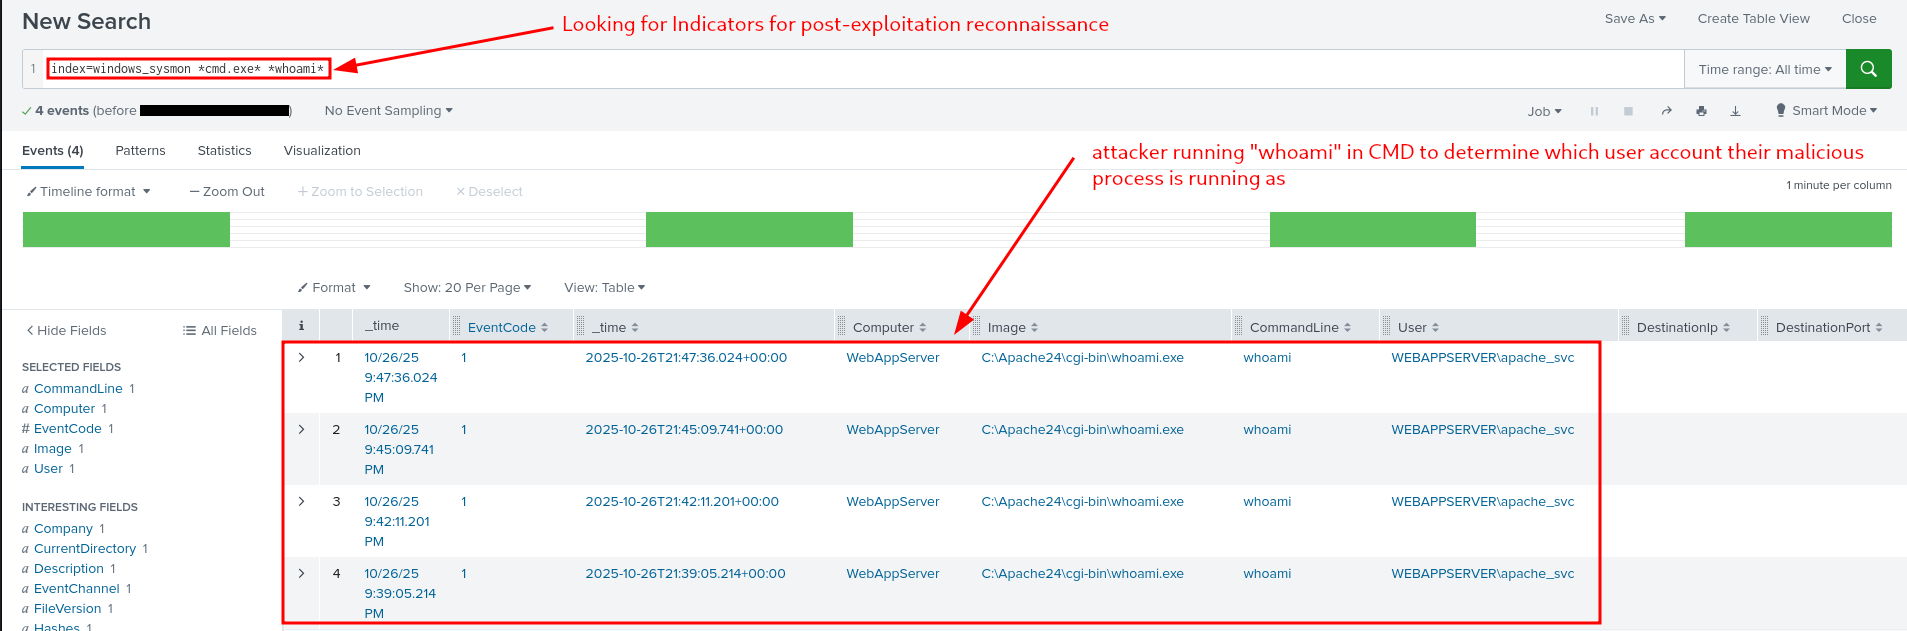
Figure 9: Indicators for Post-Exploitation Reconnaissance
Encoded Payloads
Searching for Encoded Strings/Commands successfully run by PowerShell within Sysmon Data
index=windows_sysmon Image="*powershell.exe" (CommandLine="*enc*" OR CommandLine="*-EncodedCommand*" OR CommandLine="*Base64*")
The idea behind: If your defenses were up to the tasks, such an execution was blocked and nothing is shown here. If on the other hand something is shown, you can check when and exactly what was run and getting an idea behind the attacker intensions.
Luckily, nothing is shown us here, meaning that today, our defenses were enough.
Q & A
Question-1: What is the reconnaissance executable file name?
whoami.exe
Question-2: What executable did the attacker attempt to run through the command injection?
PowerShell.exe