THM | AoC 2025 | Day 22
![]()
Day-22: C2 Detection - Command & Carol
SUMMARY
First we start out with a little theory on RITA: We learn that it detects malicious network activity by analyzing Zeek logs, identifies threats through network pattern analysis and severity scoring.
On the practical side of things: We start by converting PCAPs to Zeek logs using Zeek, then import them into RITA. We then access the RITA viewer interface.
Lastly we use RITA's filtering capabilities to answer questions by applying search filters, checking prevalence scores, examining connection counts and ports, and sorting by metrics to uncover suspicious network behavior.

C2 Detection - Command & Carol
- TL;DR: Explore how to analyze a large PCAP and extract valuable information.
- Original Room: TryHackMe | Advent of Cyber 2025 | DAY 22 - C2 Detection - Command & Carol
STORYLINE
"The TBFC, on high alert after King Malhare's attacks, grows restless in the quiet. Sir Elfo proposes hunting for Command and Control traffic using RITA (Real Intelligence Threat Analytics), a tool that can quickly analyze their network data by converting PCAP files to Zeek logs."
THEORY
RITA (Real Intelligence Threat Analytics) is an open-source framework by Active Countermeasures that detects malicious network activity by analyzing Zeek logs. It identifies threats like command and control (C2) communication, DNS tunneling, data exfiltration, and long connections through correlation of network data fields such as IP addresses, ports, timestamps, and connection durations.
Key Capabilities
RITA analyzes network patterns to detect periodic connections, excessive DNS queries, random subdomains, unusual certificate behavior, and known malicious IPs from threat intelligence feeds. It then scores connections by severity and presents findings in a searchable terminal interface.
How It Works
It requires Zeek logs as input — Zeek is a network security monitoring tool that converts packet captures (PCAPs) into structured, enriched logs. Users import these logs into RITA using the command line, and RITA parses and analyzes the data to produce results.
RITA Interface/GUI
The RITA viewer displays results in three sections:
- Search bar | Allows filtering with support for specific search fields
- Results Pane | Shows severity scores, source/destination IPs, beacon likelihood, connection duration, subdomains, and threat intelligence matches
- Details Pane | Contains threat modifiers (like MIME type mismatches, rare signatures, prevalence analysis, and unusual data volumes) and connection metadata (connection counts, bytes sent, port numbers, and protocols)
PRACTICAL
Convert PCAP to Zeek logs
Let's first check on the available data in the two directories, pcaps and zeek_logs:
ubuntu@tryhackme:~$ ls -hla pcaps/ zeek_logs/
pcaps/:
total 90M
drwxr-xr-x  2 ubuntu ubuntu 4.0K [REDACTED-TIME] .
drwxr-xr-x 22 ubuntu ubuntu 4.0K [REDACTED-TIME] ..
-rw-r--r--  1 ubuntu ubuntu  43M [REDACTED-TIME] AsyncRAT.pcap
-rw-r--r--  1 ubuntu ubuntu  41M [REDACTED-TIME] IcedID.pcap
-rw-r--r--  1 ubuntu ubuntu 7.1M [REDACTED-TIME] Pikabot.pcap
-rw-r--r--  1 ubuntu ubuntu 113K [REDACTED-TIME] rita_challenge.pcap

zeek_logs/:
total 14M
drwxrwxr-x  4 ubuntu docker 4.0K [REDACTED-TIME] .
drwxr-xr-x 22 ubuntu ubuntu 4.0K [REDACTED-TIME] ..
-rw-rw-r--  1 ubuntu docker  14M [REDACTED-TIME] Example-5-2020-08-18-Emotet-infection-with-Qakbot.pcap.zip
drwxr-xr-x  2 ubuntu ubuntu 4.0K [REDACTED-TIME] asyncrat
drwxr-xr-x  2 ubuntu ubuntu 4.0K [REDACTED-TIME] pikabot
ubuntu@tryhackme:~$
Next, we use zeek to parse and convert (zeek readpcap <pcap-file> <output-directory>) the PCAP data into a more fitting, log format:
ubuntu@tryhackme:~$ mkdir zeek_logs/rita-challenge
ubuntu@tryhackme:~$ zeek readpcap pcaps/rita_challenge.pcap zeek_logs/rita-challenge
Starting the Zeek docker container
Zeek logs will be saved to /home/ubuntu/zeek_logs/rita-challenge
ubuntu@tryhackme:~$
These are the transformed logs:
ubuntu@tryhackme:~$ ls -hla zeek_logs/rita-challenge/
total 180K
drwxr-xr-x 2 ubuntu ubuntu 4.0K [REDACTED-TIME] .
drwxrwxr-x 5 ubuntu docker 4.0K [REDACTED-TIME] ..
-rw-r--r-- 1 root   root    488 [REDACTED-TIME] analyzer.log
-rw-r--r-- 1 root   root    542 [REDACTED-TIME] capture_loss.log
-rw-r--r-- 1 root   root    47K [REDACTED-TIME] conn.log
-rw-r--r-- 1 root   root   3.6K [REDACTED-TIME] dns.log
-rw-r--r-- 1 root   root   4.4K [REDACTED-TIME] files.log
-rw-r--r-- 1 root   root    35K [REDACTED-TIME] http.log
-rw-r--r-- 1 root   root    317 [REDACTED-TIME] known_hosts.log
-rw-r--r-- 1 root   root    527 [REDACTED-TIME] known_services.log
-rw-r--r-- 1 root   root    35K [REDACTED-TIME] loaded_scripts.log
-rw-r--r-- 1 root   root   1.6K [REDACTED-TIME] notice.log
-rw-r--r-- 1 root   root    278 [REDACTED-TIME] packet_filter.log
-rw-r--r-- 1 root   root    379 [REDACTED-TIME] reporter.log
-rw-r--r-- 1 root   root   1000 [REDACTED-TIME] software.log
-rw-r--r-- 1 root   root   2.1K [REDACTED-TIME] stats.log
-rw-r--r-- 1 root   root   2.9K [REDACTED-TIME] weird.log
ubuntu@tryhackme:~$
If necessary, we can search for more information on the specific log files via their documentation.
Import Log Data into RITA
Let's use RITA to first import, then parse, and lastly analyze the freshly created logs.
ubuntu@tryhackme:~$ rita import --logs zeek_logs/rita-challenge/ --database ritachallenge
[+] up 2/2
 ✔ Container rita-syslog-ng  Running                                                                                                                                                                                        0.0s
 ✔ Container rita-clickhouse Healthy                                                                                                                                                                                        0.5s
[+]  2/2t 2/2
 ✔ Container rita-clickhouse Running                                                                                                                                                                                        0.0s
 ✔ Container rita-syslog-ng  Running                                                                                                                                                                                        0.0s
Container rita-clickhouse Waiting
Container rita-clickhouse Healthy
Container rita-rita-run-2493b7e1ece6 Creating
Container rita-rita-run-2493b7e1ece6 Created
2026-03-28T20:42:38Z INF Initiating new import... dataset=ritachallenge directory=/tmp/zeek_logs rebuild=false rolling=false started_at="[REDACTED-TIME] +0000 UTC m=+0.022579743"
[-] Parsing:  /tmp/zeek_logs/conn.log
[-] Parsing:  /tmp/zeek_logs/http.log
[-] Parsing:  /tmp/zeek_logs/dns.log
Log Parsing 🎉 ╢▌▌▌▌▌▌▌▌▌▌▌▌▌▌▌▌▌▌▌▌▌▌▌▌▌▌▌▌▌▌▌▌▌▌▌▌▌▌▌▌▌▌▌▌▌▌▌▌▌▌▌▌▌▌▌▌▌▌▌▌▌▌╟ 3 / 3
[REDACTED-TIME] INF Finished Parsing Logs! 🎉 elapsed_time=335.362979ms parsing_began=[REDACTED-TIME] parsing_finished=[REDACTED-TIME]

🧂 Seasoning SSL connections  🎉  ███████████████████████████████████████████████████████████████████████████ 100%


🧂 Seasoning HTTP connections 🎉  ███████████████████████████████████████████████████████████████████████████ 100%


✅ Sifting IP connections...

[REDACTED-TIME] INF Finished Seasoning Logs! 🎉 elapsed_time=423.68194ms seasoning_began=[REDACTED-TIME] seasoning_finished=[REDACTED-TIME]

SNI Connection Analysis 🎉  ███████████████████████████████████████████████████████████████████████████ 100%


IP Connection Analysis  🎉  ███████████████████████████████████████████████████████████████████████████ 100%


DNS Analysis            🎉  ███████████████████████████████████████████████████████████████████████████ 100%

[REDACTED-TIME] INF Finished Analysis! 🎉 analysis_began=[REDACTED-TIME] analysis_finished=[REDACTED-TIME] elapsed_time=1.929690116s
[REDACTED-TIME] INF Finished Modification! 🎉 elapsed_time=66.803453ms modification_began=[REDACTED-TIME] modification_finished=[REDACTED-TIME]
[REDACTED-TIME] INF Finished Importing Hour Chunk day=0 elapsed_time=3.025971832s hour=0
[REDACTED-TIME] INF 🎊✨ Finished Import! ✨🎊 elapsed_time=4.3s
[+] stop 1/1
 ✔ Container rita-rita-1 Stopped                                                                                                                                                                                            0.0s
ubuntu@tryhackme:~$
Everything is prepared, let's check the data with rita view <database-name>:
ubuntu@tryhackme:~$ rita view ritachallenge
[+] up 2/2
 ✔ Container rita-syslog-ng  Running                                                                                                                                                                                        0.0s
 ✔ Container rita-clickhouse Healthy                                                                                                                                                                                        0.5s
[+]  2/2t 2/2
 ✔ Container rita-clickhouse Running                                                                                                                                                                                        0.0s
 ✔ Container rita-syslog-ng  Running                                                                                                                                                                                        0.0s
Container rita-clickhouse Waiting
Container rita-clickhouse Healthy
Container rita-rita-run-a40a9aacc2eb Creating
Container rita-rita-run-a40a9aacc2eb Created
Viewing database: ritachallenge
The RITA GUI (within the Terminal) will be displayed with data populated from the ritachallenge database.
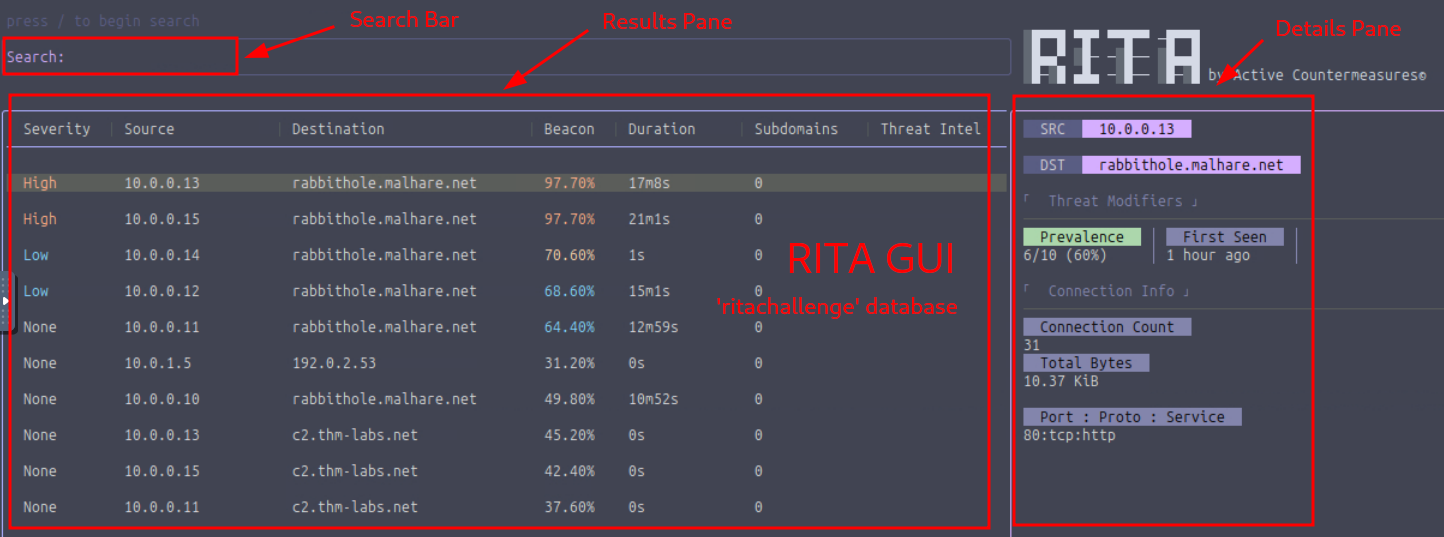
Figure 1: RITA GUI
Q & A
Question-1: How many hosts are communicating with malhare.net?
6
Prevalence denotes the number of internal hosts communicating with a specific - here malhare.net - external host. All we have to do is to select one entry which is inside of the target domain - like rabbithole.malhare.net - and use the Details Pane to check on it's Prevalence score.
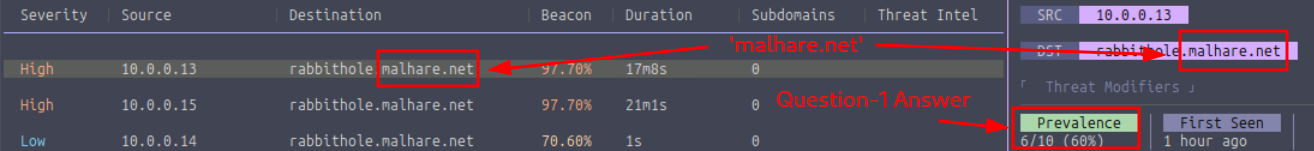
Figure 2: Number of Hosts communicating with the Target Domain
Question-2: Which Threat Modifier tells us the number of hosts communicating to a certain destination?
Prevalence
See above in Question-2.
Question-3: What is the highest number of connections to rabbithole.malhare.net?
40
Let's use the filter dst:rabbithole.malhare.net to restrict the enties and use the Details Pane to search for the entry with the highest connection count.
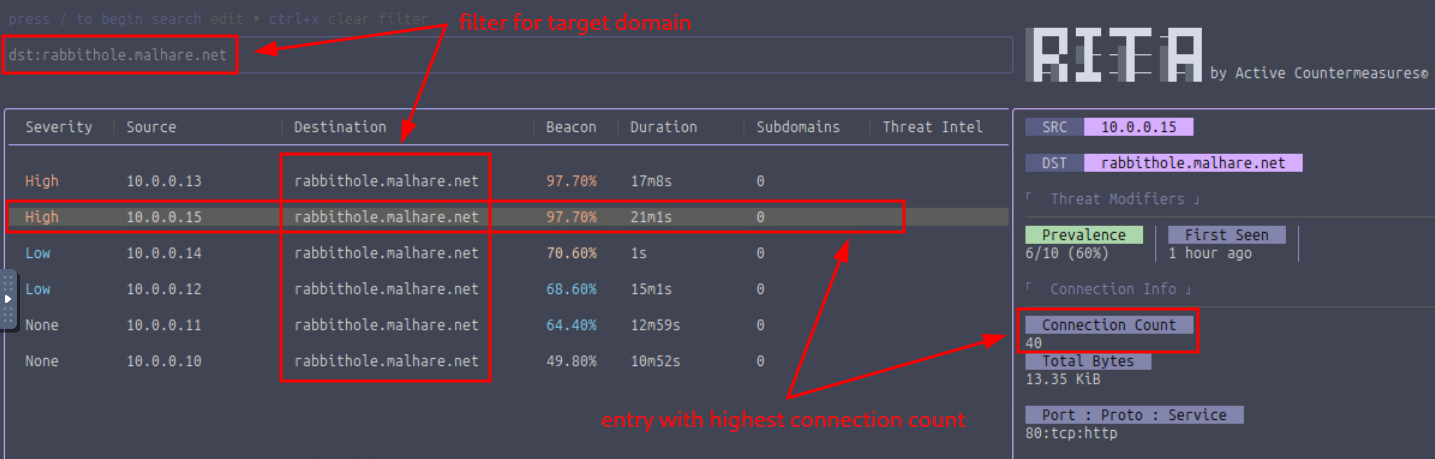
Figure 3: Entry with the Highest Connection Count
Question-4: Which search filter would you use to search for all entries that communicate to rabbithole.malhare.net with a beacon score greater than 70% and sorted by connection duration (descending) ?
dst:rabbithole.malhare.net beacon:>=70 sort:duration-desc
This is how it looks like with the filtered entries:
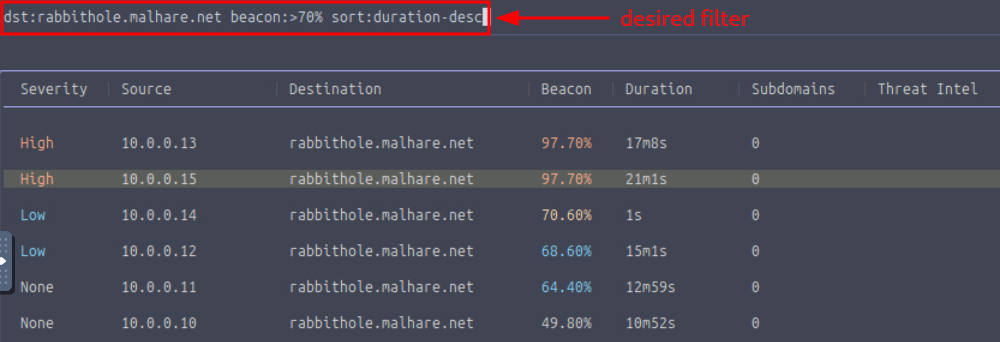
Figure 4: Filtered Entries
Question-5: Which port did the host 10.0.0.13 use to connect to rabbithole.malhare.net?
80
Let's first check end select the specified internal host 10.0.0.13 by using the Source column, then check the entry's Details Pane the Port:Proto:Service entry under the Connection Info section.
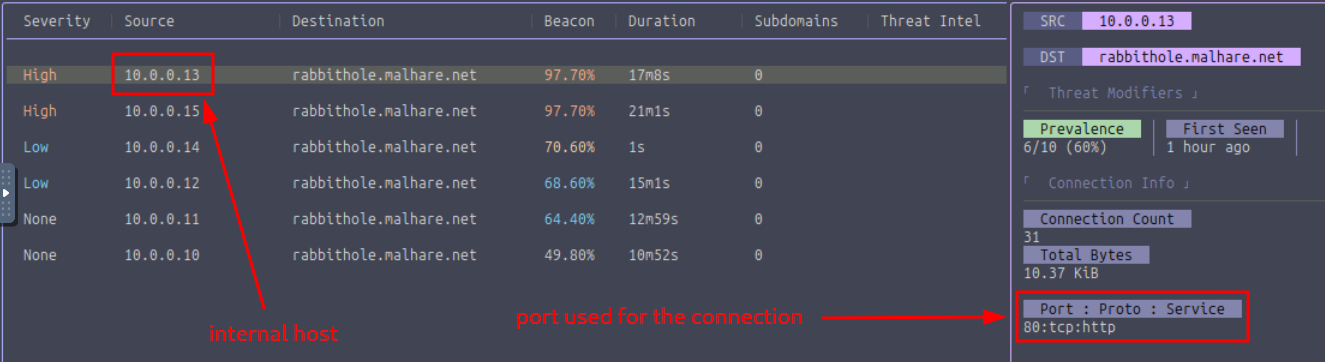
Figure 5: Port used to connect to the target